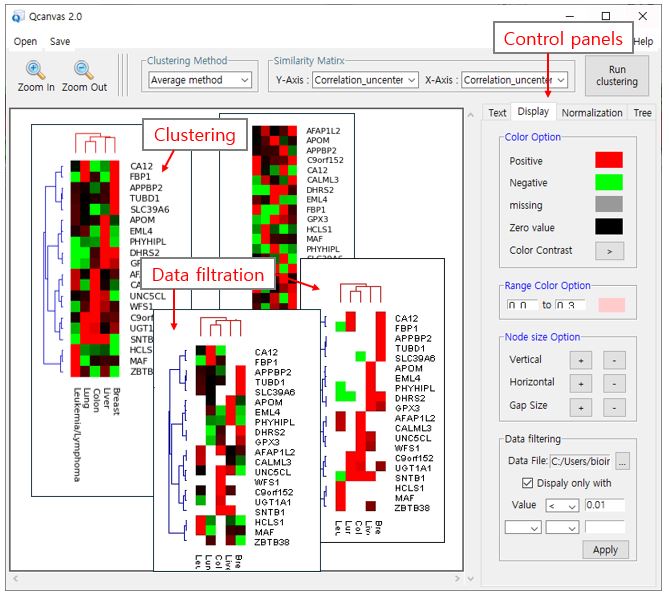
We have developed a user-friendly, interactive software to cluster and visualize omics
data. It provides diverse algorithms for hierarchical clustering of two dimensional data.
The clustering result can be interactively visualized and optimized on a heatmap.
The present tool does not require any prior knowledge on scripting language to carry out the data clustering and visualization.
Furthermore, additional dataset can be overlaid on the analysis of a given dataset.
For example, a clustered heatmap of experimental data can be differentially visualized by using a statistical confidence such as p-values.
Including diverse menu-based display options, QCanvas provides a convenient tool for pattern analysis and high quality image generation.
It is possible to change the color, position and size of data cells, labels and trees.
Clustered heatmaps can be saved in a postscript file.