Core engine
Q-omics Core
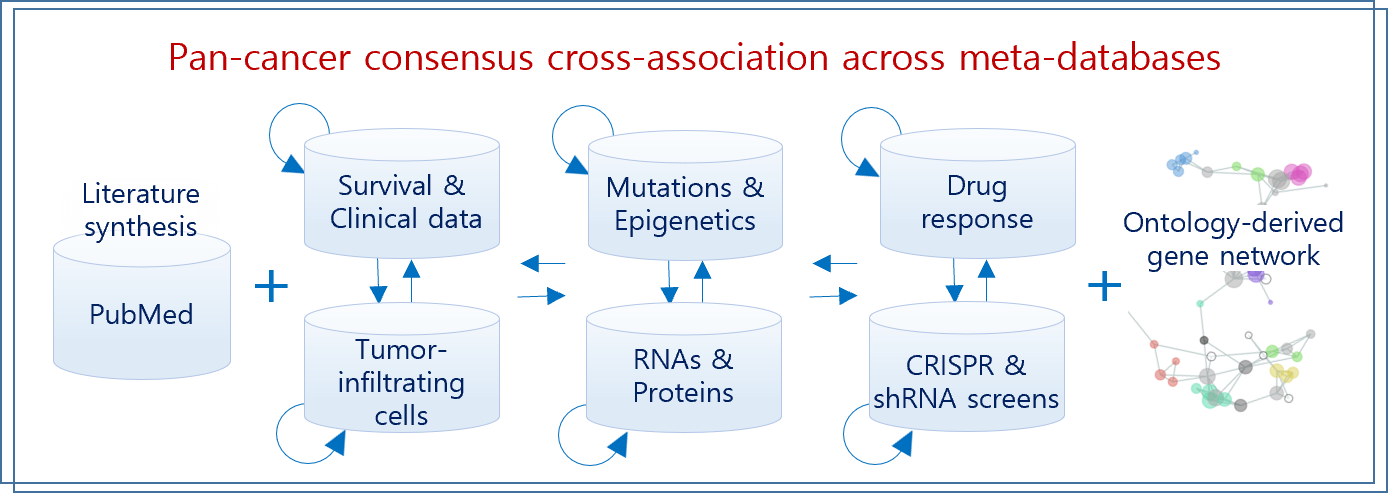
Consensus cross-association across 30+ billion records spanning multi-omics and clinical layers.
Q-omics 3 integrates pan-cancer cell line and patient data with AI-powered literature intelligence (OmixMind) and ontology-based gene networks (NetCrafter), enabling robust target and biomarker discovery.
Consensus cross-association across 30+ billion records spanning multi-omics and clinical layers.
AI-driven literature intelligence that summarizes key findings and suggests Q-omics analysis.
Ontology-based gene and phenotype networks for functional interpretation.
Literature intelligence, multi-omics meta-analysis, and ontology-guided networks support key workflows in research and drug discovery.
Explore vulnerabilities, pathway dependencies, and synthetic lethal partners around targets using CRISPR/shRNA and drug response.
Link genes, pathways, and phenotypes using multi-layer omics data and NetCrafter networks to understand functional mechanisms.
Integrate cell line models and patient cohorts to find robust, lineage-agnostic or lineage-specific targets and biomarkers.
Mine synthetic lethal pairs and tumor-specific neoantigen candidates by combining CRISPR/shRNA, RNA, protein and mutation data.
Q-omics integrates pan-cancer cell line and patient data, enabling cross-association across RNA, protein, mutations, drug response, CRISPR/shRNA, infiltrating cells, and function-level features.
20+ lineages and >1,000 cell lines with RNA, protein (RPPA, MS), mutations, CRISPR, shRNA, and drug response.
DepMap, CCLE, GDSC, NCI6030+ tumor types with RNA, proteomics, mutations, infiltrating cells, survival, and paired normal vs. tumor data.
TCGA, GENIE, CPTAC, xCellGene interaction and enrichment profiles derived from RNA, protein, CRISPR, and shRNA in both cell lines and patient samples.
GO, HPO and related ontologies| Data set | # Lineages | # Samples | # Entities | Data type | Source / Download | |
|---|---|---|---|---|---|---|
| Cell line data | RNA expression | 20 | 1,061 | 19,137 | RNA sequencing | CCLE[1] / DepMap Expression 20Q1[2] |
| Protein expression and phosphorylation | 20 | 899 | 214 | Reverse Phase Protein Array | DepMap / Protein Array[2] | |
| Protein abundance | 20 | 949 | 8,424 | Mass spectrometry | [11] | |
| sgRNA | 20 | 741 | 18,110 | CRISPR | DepMap / CRISPR 20Q1[2] | |
| shRNA | 20 | 587 | 16,800 | RNAi shRNA | DepMap / RNAi (Achilles + DRIVE + Marcotte, DEMETER2)[2] | |
| Drug response | 20 | 1,001 | 561 | Drug response | GDSC[3] / DepMap Sanger GDSC1 and GDSC2[2] | |
| Mutations | 20 | 1,281 | 18,731 | Exome sequencing | CCLE / DepMap Mutation 20Q1[2] | |
| Methylation | 20 | 713 | 19,867 | Bisulfite sequencing (RRBS) | CCLE / DepMap Methylation[2] | |
| Drug-induced RNA expression | 13 | 60 | 12,305 (genes) 15 (drugs) |
DNA microarray | NCI60[4] / GSE116436[5] | |
| RNA expression-based GO enrichment | 20 | 1,061 | 7,172 (GO) | Enrichment score | GO[14] | |
| Protein abundance-based GO enrichment | 20 | 848 | 7,172 (GO) | Enrichment score | GO[14] | |
| sgRNA-based GO enrichment | 20 | 635 | 7,172 (GO) | Enrichment score | GO[14] | |
| shRNA-based GO enrichment | 20 | 585 | 7,172 (GO) | Enrichment score | GO[14] | |
| Tissue data | Tumor RNA expression | 34 | 9,951 | 38,311 | RNA sequencing | TCGA[6], GENIE[7], CPTAC[12] / GDC portal[8] |
| Protein expression and phosphorylation | 32 | 6,985 | 275 | Reverse Phase Protein Array | TCGA / GDC portal | |
| Protein abundance and post-translational modification | 10 | 1,067 | >50,000 | Mass spectrometry | CPTAC / PDC portal[13] | |
| Paired normal vs. tumor: RNA expression | 18 | 679 | 38,311 | RNA sequencing | TCGA / GDC portal | |
| Somatic mutations | 34 | 9,100 | 20,850 | Exome sequencing | TCGA, GENIE / GDC portal | |
| Infiltrating cells | 33 | 8,954 | 64 (cell types) | Cell type enrichment score | xCell[9] / xCell portal[10] | |
| Tumor Methylation | 32 | 7,931 | 37,952 | Methylation array | TCGA / GDC portal | |
| Paired normal vs. tumor: Methylation | 22 | 708 | 37,952 | Methylation array | TCGA / GDC portal | |
| RNA expression-based GO enrichment | 34 | 9,951 | 7,172 (GO) | Enrichment score | GO[14] | |
| Protein abundance-based GO enrichment | 10 | 1,029 | 7,172 (GO) | Enrichment score | GO[14] | |
|
[1] Barretina et al. (2012) The Cancer Cell Line Encyclopedia enables predictive modelling of anticancer drug sensitivity. Nature 483, 603–607. [2] https://depmap.org/portal/download/ [3] Yang et al. (2013) Genomics of Drug Sensitivity in Cancer (GDSC): a resource for therapeutic biomarker discovery in cancer cells. Nucleic Acids Research 41 (Database issue): D955–D961. [4] Monks et al. (2018) The NCI Transcriptional Pharmacodynamics Workbench: A Tool to Examine Dynamic Expression Profiling of Therapeutic Response in the NCI-60 Cell Line Panel. Cancer Res 78, 6807–6817. [5] https://www.ncbi.nlm.nih.gov/geo/query/acc.cgi?acc=GSE116436 [6] Cancer Genome Atlas Research Network et al. (2013) The Cancer Genome Atlas Pan-Cancer analysis project. Nat. Genet 45, 1113–1120. [7] AACR Project GENIE Consortium (2017) AACR Project GENIE: Powering Precision Medicine through an International Consortium. Cancer Discovery 7(8):818–831. [8] https://portal.gdc.cancer.gov/ [9] Dvir A., Zicheng H. and Atul J.B. (2017) xCell: digitally portraying the tissue cellular heterogeneity landscape. Genome Biology 18:220. [10] https://xcell.ucsf.edu/ [11] Gonçalves et al. (2022) Pan-cancer proteomic map of 949 human cell lines. Cancer Cell 40(8), 835–849. [12] https://proteomics.cancer.gov/ [13] https://proteomic.datacommons.cancer.gov/pdc/ [14] https://geneontology.org/ |
||||||
Q-omics Smart DBs allow cross-association, survival, and synthetic lethal patterns to be retrieved in seconds
| Database name | Analysis type | # Tables | # Records |
|---|---|---|---|
| Cross association in cell line samples | Cross-association hits between pairs of entities among 11 datasets | 48[1] | 2,112,908,469 |
| Cross association in patient samples | Cross-association hits between pairs of entities among 7 datasets | 18[2] | 5,070,903,952 |
| Survival analysis in patient samples | Survival hits using 7 datasets | 8[3] | 1,054,407 |
| Survival analysis between omics datasets | Survival hits between omics datasets using 5 datasets | 23[4] | 14,492,821,675 |
| Cross association with drug response (patients) | Cross-association hits between 4 datasets and drug response | 6[5] | 973,619 |
| Drug-induced RNA expression (cell lines) | Differentially expressed RNA and enriched GO function hits across drug doses and treatment times | 2[6] | 372,905 |
| Normal vs. tumor comparison | Differential hits using 5 datasets | 5[7] | 662,358 |
| Synthetic lethal analysis | Down-regulated gene pair hits between sgRNA vs. RNA, shRNA vs. RNA (cell lines) and survival-based RNA vs. RNA pairs (patients) | 3[8] | 12,406,678 |
| Neoantigen analysis | Differential neoantigen burden and tumor-specificity of 898 cell-surface genes | 2[9] | 80,170 |
| Gene, drug, GO function summary | Hit density summary per gene / drug / GO term in Smart DBs | 3[10] | 1,371,696 |
|
Abbreviation: Protein (RPPA) – protein expression and phosphorylation by Reverse Phase Protein Array; Protein (MS) – protein abundance and post-translational modification by mass spectrometry. [1] Cross-association pairs among Drug response, Protein (RPPA), RNA expression, GO enrichments, Protein (MS), sgRNA, shRNA, Mutation, etc. [2] Cross-association pairs among infiltrating cells, Protein (MS), RNA expression, Mutation, Protein (RPPA), and GO enrichment layers. [3] Survival hits using RNA expression, Mutation, Infiltrating cell, Protein (RPPA), Protein (MS), RNA expression-based GO enrichment. [4] Survival hits between infiltrating cells, mutations, Protein (MS), Protein (RPPA), and RNA expression. [5] Gene/Mutation/Infiltrating cells/Protein (RPPA) vs. 15 drug responses, Gene/Infiltrating cells vs. Pembrolizumab response. [6] Differentially expressed RNA and differentially enriched GO functions. [7] Differential hits in RNA expression, Protein (MS), Infiltrating cells, and GO-based enrichments. [8] sgRNA vs. RNA expression, shRNA vs. RNA expression, RNA expression vs. RNA expression. [9] Cross-association hits between neoantigens and sgRNA/shRNA, and neoantigen-related survival hits. [10] Summary statistics per gene, drug, and GO function. |
|||