
Ontology-derived gene network modeling, visualization and functional interpretation
|
NetCrafter is an intuitive platform for constructing functional gene networks using biological ontologies. By simply providing a list of genes, users can generate customized networks without relying on prior gene-gene interaction data. NetCrafter quantifies shared biological functions among genes using resources such as the Gene Ontology (GO), Human Phenotype Ontology (HPO), Hallmark genesets and Oncogenic Signature collections, allowing users to contextualize their results within well-established functional and disease-related frameworks. >> See details of NetCrafter ontologies This ontology-based scoring enables the creation of networks that reflect functional similarity and highlight key gene clusters (hotspots) related to biological pathways or disease phenotypes. |
|
Ontology-based gene network construction 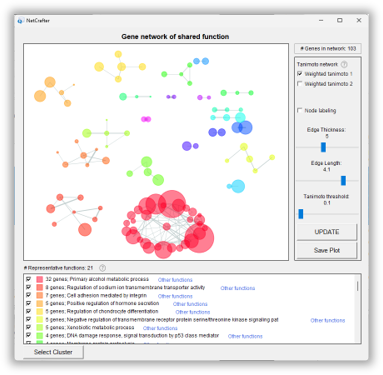
|
Functional gene network inference Smart network automatically suggests essential subnetworks 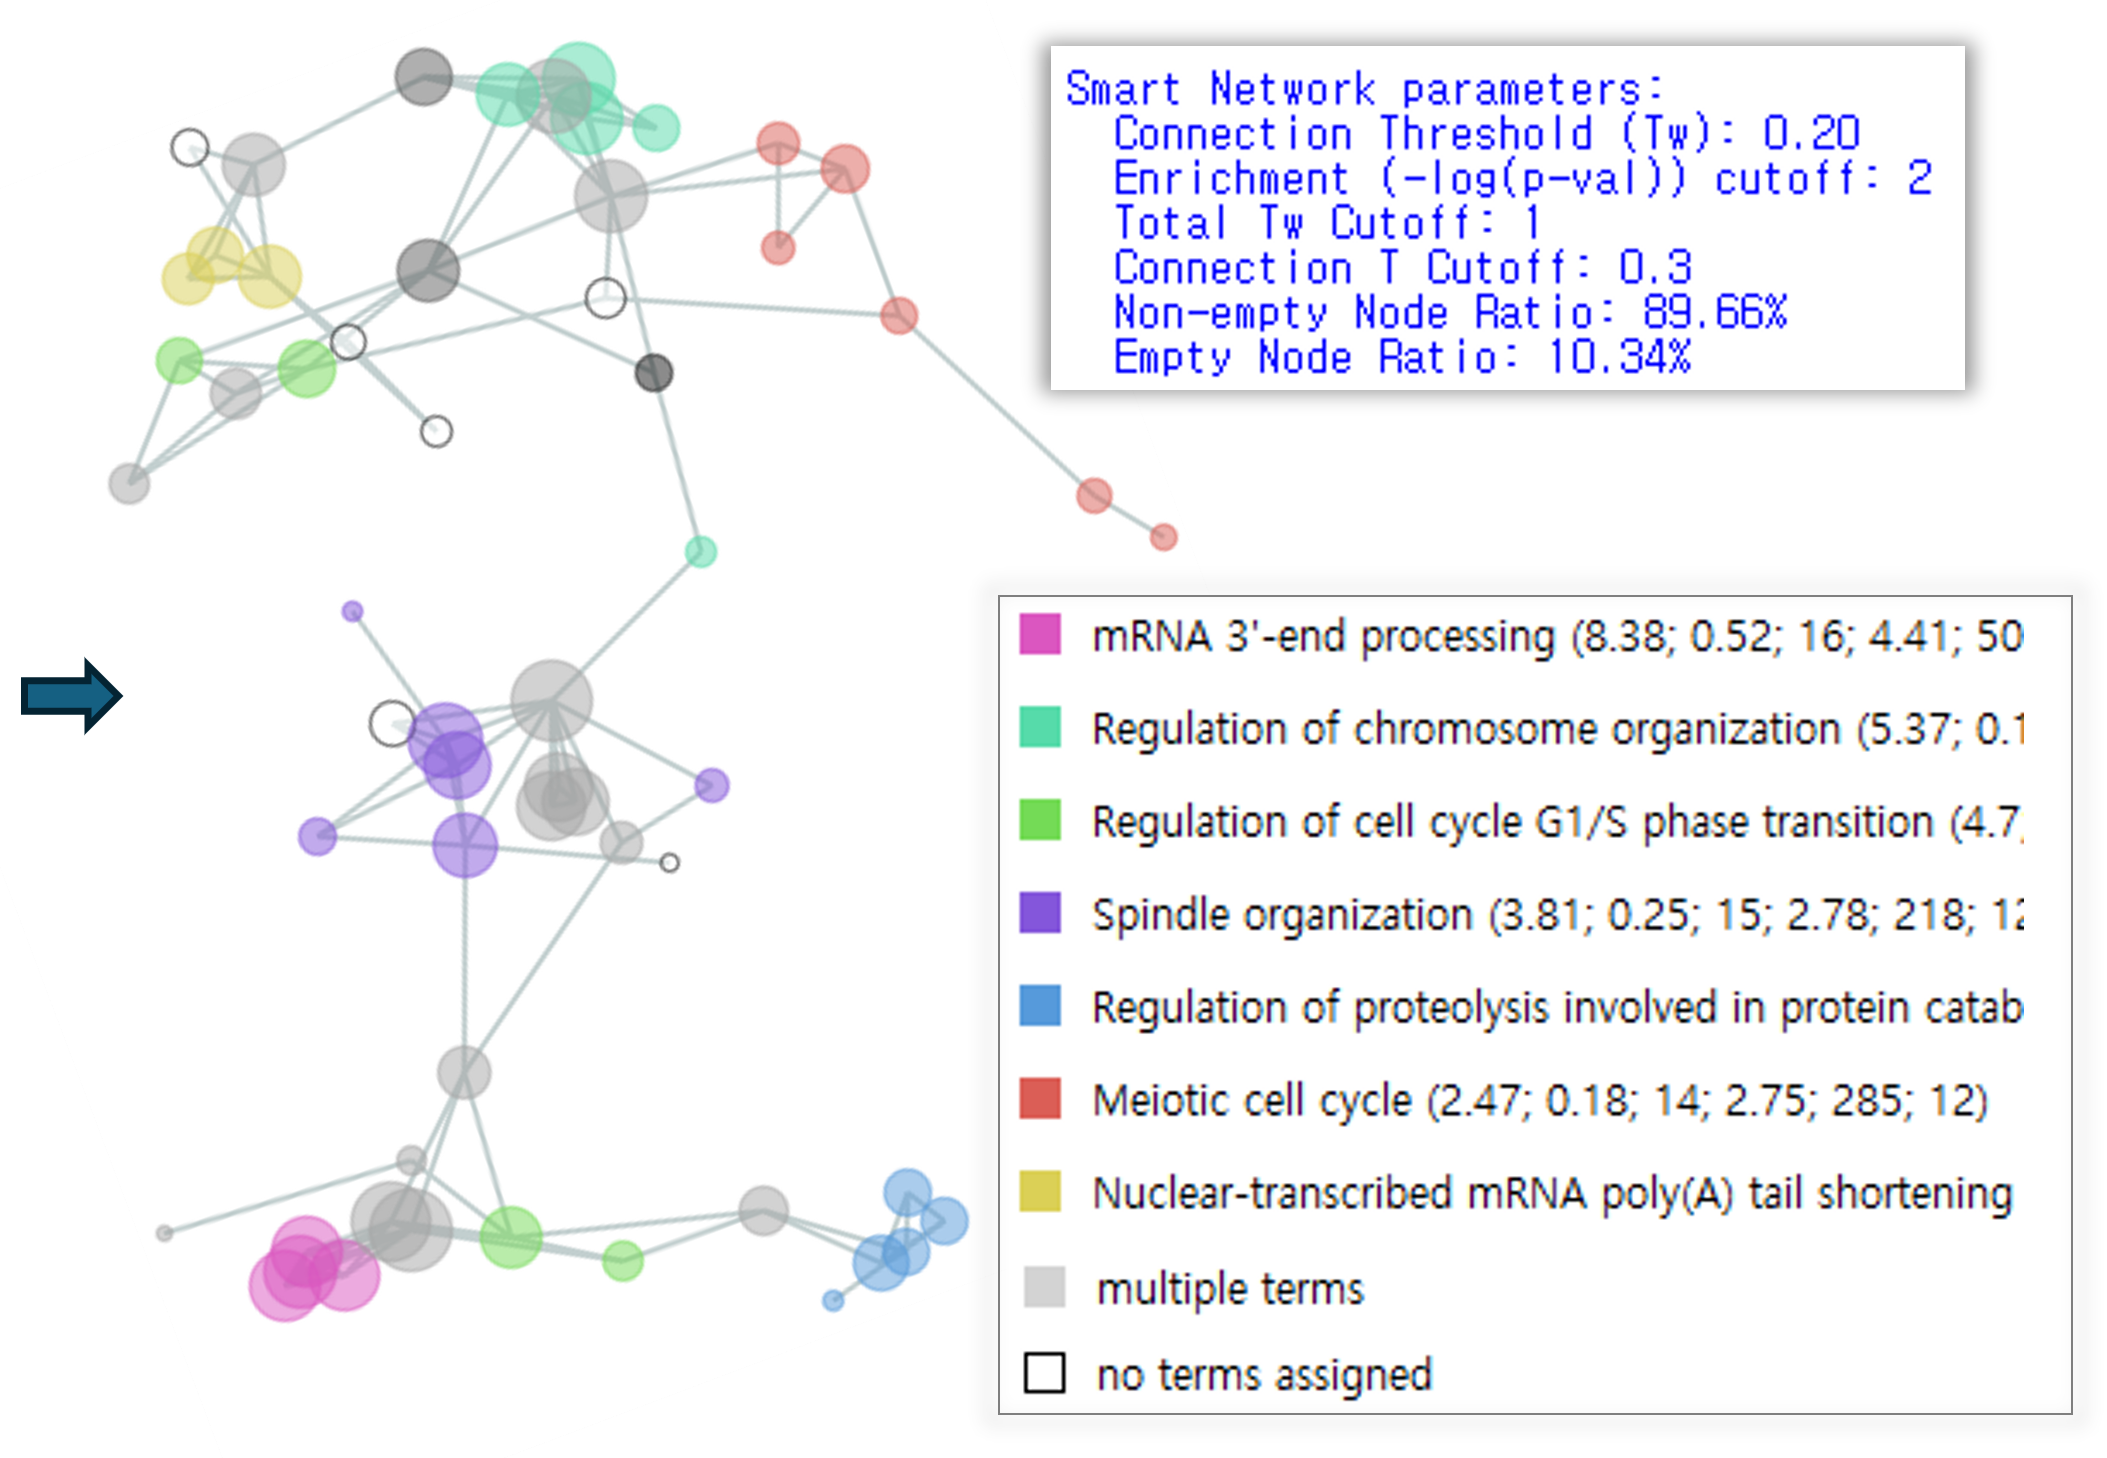
|
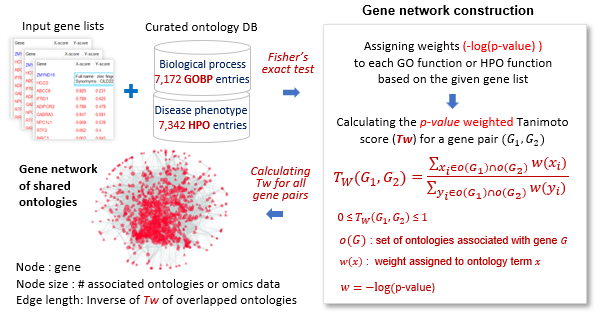
Creating ontology-based gene networks
The figure illustrates the process of generating networks using Gene Ontology Biological Process (GOBP) terms and Human Phenotype Ontology (HPO)
terms containing 3 to 300 genes.
For a gene list, the -log(p-value) of each ontology term was calculated using Fisher's exact test. Tw(G1, G2) denotes the p-value weighted Tanimoto score.
 |
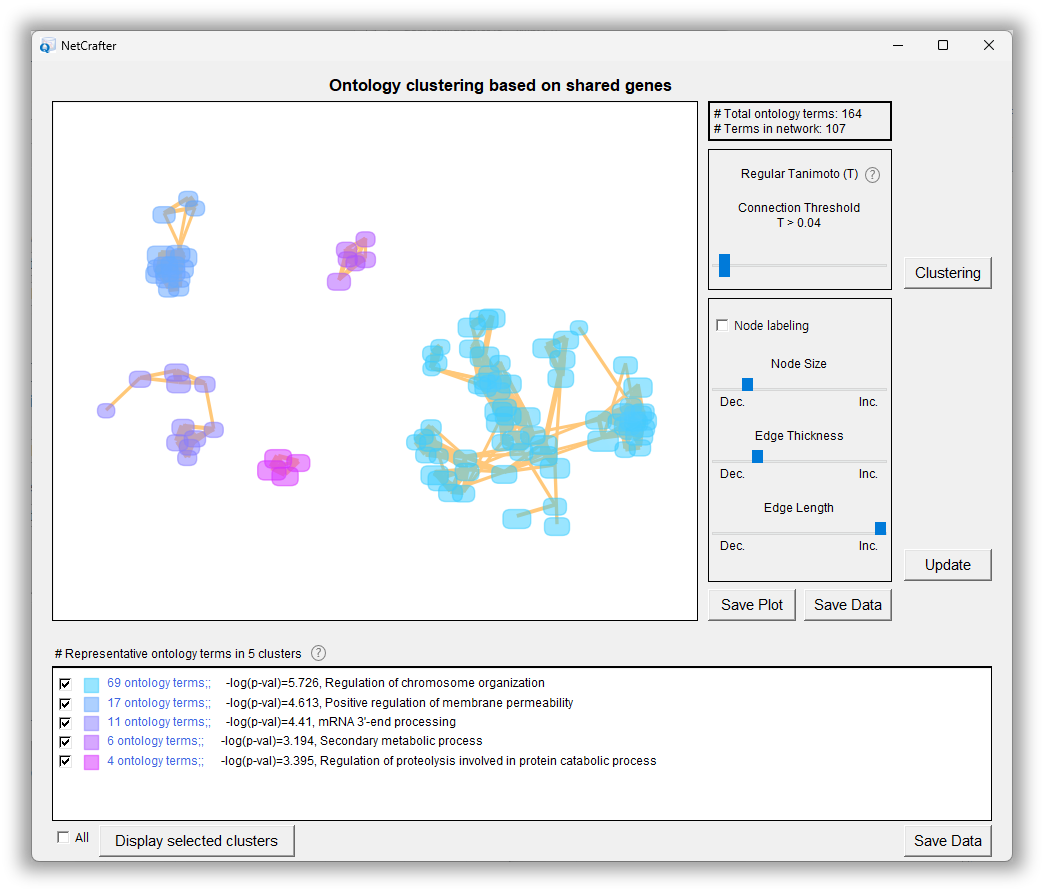
Ontology clustering
In addition, NetCrafter offers interactive ontology clustering and supports the integration of multiple datasets, making it a powerful tool for exploring gene functions, interpreting omics data, and identifying potential biomarkers or therapeutic targets.
|
Input ontology terms were clustered using the regular Tanimoto index between terms, T(O1, O2), which measures the overlap in shared genes.
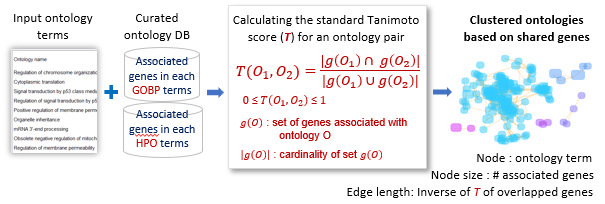 |