Consensus Scores
An indicator of data robustness and reproducibility. Do not rely on a single p-value.
Why Consensus Matters?
Q-omics evaluates the robustness of data associations by testing them across diverse analytical conditions. A high consensus score reduces false positives caused by specific sample splits or cut-offs.
Q-omics evaluates the robustness of data associations by testing them across diverse analytical conditions. A high consensus score reduces false positives caused by specific sample splits or cut-offs.
Sampling Consensus (Technical)
How consistently is the association observed when changing analysis parameters (e.g., sample splitting, gender, stage)?
Lineage Consensus (Biological)
Is this association specific to a single cancer type (Unique) or conserved across multiple tumor lineages (Pan-cancer)?
Example 1: Gene Expression & Patient Survival
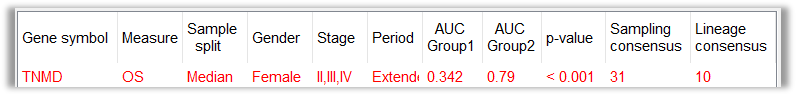
Interpretation of the Score (31 / 144)
- The Scenario: TNMD expression shows a significant association with patient survival (OS) in ACC females (Stage II-IV).
- Sampling Consensus (31): This association was reproducible in 31 out of 144 different sampling subgroups.
- Denominator (144): Derived from all possible combinations of: Data split (Median/Quartile), Gender, Stage, Measures (OS/DFS) & Periods.
Lineage Consensus (10)
- In 10 tumor lineages out of 34, TNMD expression is significantly (p<0.05) associated with patient survival in at least one sampling group.
Example 2: Drug Response & Gene Expression
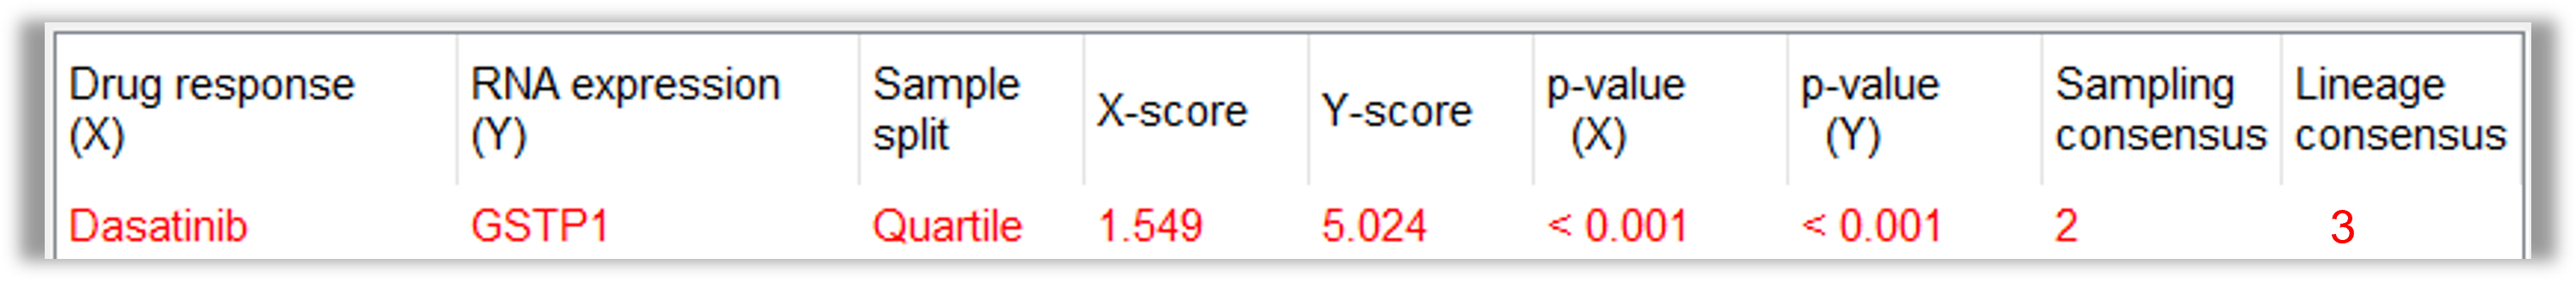
Interpretation of the Score (2 / 4)
- The Scenario: Dasatinib response is correlated with GSTP1 expression in Breast cancer cell lines.
- Sampling Consensus (2): Significant correlation was found in 2 out of 4 analytical conditions.
- Denominator (4): Combinations of data splitting methods for both Drug response and Gene expression (Median vs. Quartile).
Lineage Consensus (3)
- This drug-gene association is observed in 3 out of 20 different cancer lineages (Pan-cancer potential).